


Sun Life Reports 2Q 2019 Net Income of $595M
Sun Life Financial Inc. (PSE: SLF) today announced its results for the second quarter ended June 30, 2019. Second quarter reported net income was $595 million and underlying net income was $739 million.
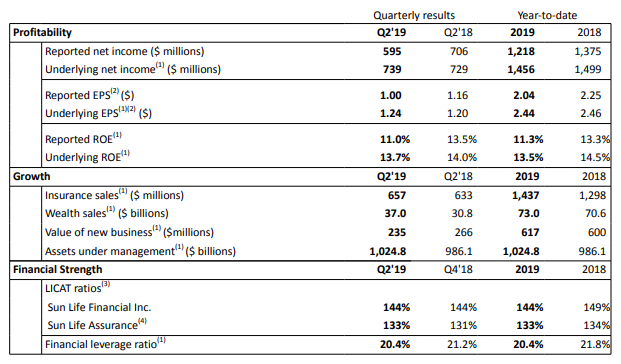
“We delivered underlying net income of $739 million in the second quarter, up from $729 million in the prior year,” said Dean Connor, President & CEO of Sun Life. “Interest rates declined in the quarter leading to lower reported net income, while balance sheet strength continued with a 144% LICAT ratio, $2.2 billion of cash at the holding company level and a low Financial leverage ratio. We are pleased to announce a new share buyback program for the repurchase of up to 15 million shares, subject to regulatory approval.”
“We had a number of key developments in our Asset Management businesses this quarter. MFS achieved a pre-tax net operating profit margin ratio of 37%, expanded its non-U.S. distribution, launched two products for European distribution, increased gross sales by 22% and delivered positive net retail fund flows of $2 billion,” Connor added. “We also rebranded our alternatives asset management business to SLC Management. We consolidated our fixed income businesses, Prime Advisors, Ryan Labs and Sun Life Institutional Investments, under this one brand to create an integrated distribution team that offers institutional Clients our broad spectrum of solutions. SLC Management’s real estate arm completed the acquisition of a majority stake in BentallGreenOak.”
- (1) Represents a non-IFRS financial measure. See section M – Non-IFRS Financial Measures in this document.
- (2) All EPS measures refer to fully diluted EPS, unless otherwise stated.
- (3) For further information on the Life Insurance Capital Adequacy Test (“LICAT”), see section E – Financial Strength in this document.
- (4) Sun Life Assurance Company of Canada (“Sun Life Assurance”) is SLF Inc.’s principal operating life insurance subsidiary.
Financial and Operational Highlights – Quarterly Comparison (Q2 2019 vs. Q2 2018)
Our strategy is focused on four key pillars of growth, where we aim to be a leader in the markets in which we operate, with our continued progress detailed below.
Our reported net income of $595 million in the second quarter of 2019 decreased $111 million compared to the second quarter of 2018, primarily reflecting unfavourable market related and assumption changes and management actions(1) (“ACMA”) impacts. Underlying net income in the second quarter of 2019 increased $10 million to $739 million compared to the same period in 2018, primarily driven by business growth, favourable expense experience and benefits from tax related items primarily in the U.S., partially offset by unfavourable morbidity experience in Canada and the U.S., lower new business gains in International in Asia, and lower available-for-sale (“AFS”) gains in the U.S.
Our reported ROE(1) was 11.0% in the second quarter of 2019. Underlying ROE(1) was 13.7%, compared to 14.0% in the second quarter of 2018, reflecting higher underlying net income offset by increased common shareholders’ equity due to higher retained earnings and the impact of market movements reflected in other comprehensive income. SLF Inc. and its wholly-owned holding companies ended the quarter with $2.2 billion in cash and other liquid assets, reflecting the redemption of $250 million of subordinated debt which also decreased our financial leverage ratio(1) to 20.4%.
A Leader in Insurance and Wealth Solutions in our Canadian Home Market
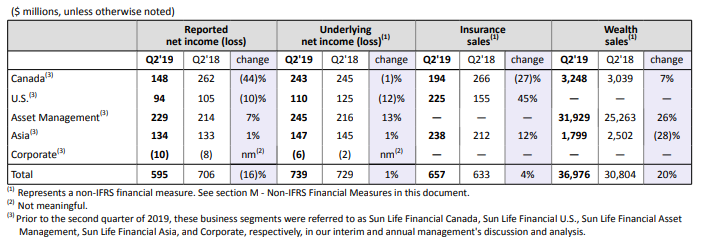
Canada’s reported net income was $148 million in the second quarter of 2019, a decrease of $114 million compared to the same period in 2018, predominantly reflecting unfavourable market related and ACMA impacts. Underlying net income was $243 million, in line with the same period in 2018, reflecting favourable expense experience and continued business growth, offset by unfavourable morbidity and credit experience.
Canada insurance sales decreased 27% to $194 million in the second quarter of 2019, reflecting lower sales in Group Benefits (“GB”) due to timing of large case sales and individual insurance. Wealth sales were up 7%, driven by increased sales in Group Retirement Services (“GRS”), which continues to lead the industry in assets under administration(1)(2)(“AUA”).
We are continuing to shape the Canadian market through innovation and digital capabilities that enhance our Client’s experience. Our digital platform, Lumino Health, provides Canadians one point of contact for a comprehensive range of health resources, including empowering Canadians to find the health care providers and health innovations they need. Our Sun Life Health platform delivers value to Canadians, as evidenced by over 10 million health care provider user ratings and average usage of approximately 10,000 searches per day.
- (1) Represents a non-IFRS financial measure. See section M – Non-IFRS Financial Measures in this document.
- (2) Benefits Canada’s 2018 CAP supplier survey, based on June 30, 2018 AUA.
A Leader in U.S. Group Benefits
U.S.’s reported net income was $94 million in the second quarter of 2019, a decrease of $11 million compared to the second quarter of 2018, reflecting more unfavourable market related impacts, partially offset by lower integration costs. Underlying net income was $110 million, a decrease of $15 million from the same period in the prior year, reflecting less favourable morbidity experience and lower AFS gains, partially offset by improved lapse and other policyholder behaviour experience and benefits from tax related items. The after-tax profit margin for Group Benefits(1) was 7.3% as of the second quarter of 2019 compared to 6.5% as of the second quarter of 2018.
U.S. Group Benefits sales increased 40% compared to the second quarter of 2018, driven primarily by continued strong momentum and our leadership position in medical stop-loss. Medical stop-loss business in-force increased to $1.8 billion, up 22% from the same period in the prior year.
During the quarter, the U.S. launched a program to help employers auto-enroll employees in disability coverage, which provides an extra layer of income protection and financial security when members cannot work because of a serious illness or injury, helping to close gaps in coverage for our members. In addition, as the leading independent provider of medical stop-loss coverage, we analyzed our deep database of medical claims and released our annual High-cost claims and injectable drug trends report(2), which provides employers with actionable recommendations about the trends and costs affecting their health plans, enabling them to bend the medical cost curve.
A Leader in Global Asset Management
Asset Management’s reported net income was $229 million in the second quarter of 2019, an increase of $15 million from the second quarter of 2018, driven by the change in underlying net income, partially offset by higher fair value adjustments in MFS’s share based payment awards and acquisition costs in SLC Management. Underlying net income was $245 million, an increase of $29 million from the same quarter last year, driven by expense management, investment income including returns on seed capital and the favourable impact of foreign exchange. The pre-tax net operating profit margin ratio for MFS (1) was 37% in the second quarter of 2019, compared to 36% in the same period last year.
Asset Management ended the second quarter with $708.1 billion in assets under management, consisting of $639.9 billion ($488.8 billion) in MFS Investment Management (“MFS”) and $68.2 billion in SLC Management. MFS experienced net outflows of $8.1 billion ($6.1 billion) in the quarter, which included positive net retail fund flows of $2.6 billion ($2.0 billion).
In the second quarter of 2019, 93%, 92% and 84% of MFS’s U.S. retail fund assets ranked in the top half of their Lipper categories based on ten-, five- and three-year performance, respectively.
On July 1, 2019, we completed the acquisition of our majority stake in BentallGreenOak, which was the product of the merger of the Bentall Kennedy group of companies and GreenOak Real Estate, a global real estate investment firm. This acquisition increases our global real estate investment footprint, while adding organizational depth and a full spectrum of solutions including equity and debt real estate strategies. The expected reduction to Total shareholders’ equity as a result of the acquisition is approximately $850 million, primarily driven by the establishment of financial liabilities associated with the anticipated increase of our future ownership in BentallGreenOak.
A Leader in Asia through Distribution Excellence in Higher Growth Markets
Asia’s reported net income was $134 million in the second quarter of 2019, which was in line with the second quarter of 2018, as unfavourable market related impacts were offset by the impact of acquisition, integration and restructuring costs in the second quarter of 2018. Underlying net income of $147 million was in line with the second quarter of 2018, reflecting favourable expense experience, favourable credit experience, and continued business growth, largely offset by lower new business gains in International.
Asia insurance sales were $238 million in the second quarter of 2019, up 12% compared to the second quarter of 2018, with doubledigit growth in most markets. International experienced lower sales but saw improvements from the prior quarter as a result of a new product launch. Asia wealth sales were down by 28% to $1.8 billion in the second quarter of 2019, primarily due to lower sales in India as a result of weak market sentiments.
In Asia, we continue to execute our growth strategy. Agency sales in Asia were up 21% from the prior year, backed by our Most Respected Advisor program and digital enhancements to our advisor applications to improve the Advisor and Client experience. We also continued to improve our digital service experience for Clients. For example, Hong Kong launched a group medical app, which had positive adoption with both Client registrations and outpatient claim submissions, and Bowtie(3) launched its online platform and first medical insurance product in April.
- (1) Represents a non-IFRS financial measure. See section M – Non-IFRS Financial Measures in this document.
- (2) The 2019 High-cost claims and injectable drug trends report can be accessed at https://sunlife.showpad.com/share/7SzmNmJJs1a6msorM0DZA.
- (3) We have a strategic investment in Bowtie Life Insurance Company, the first virtual insurer in Hong Kong approved under the Fast Track process.
